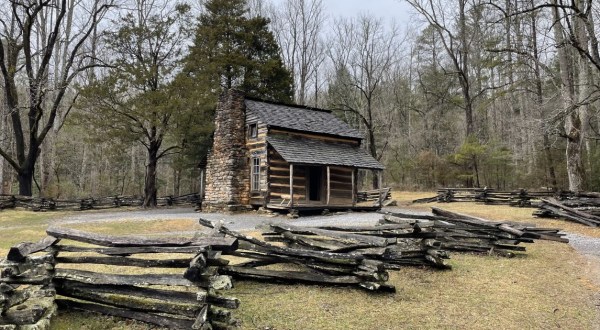
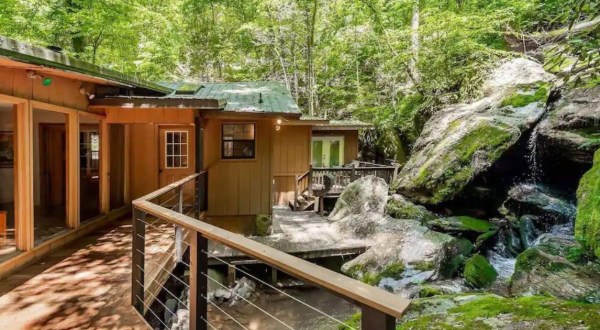
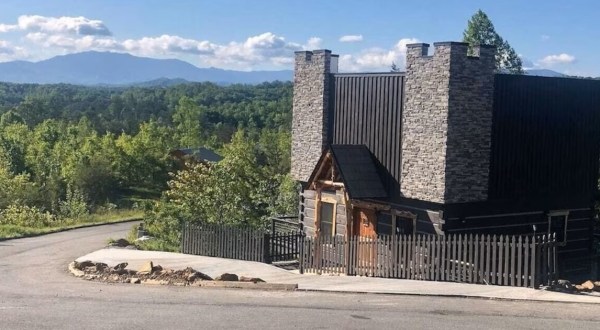
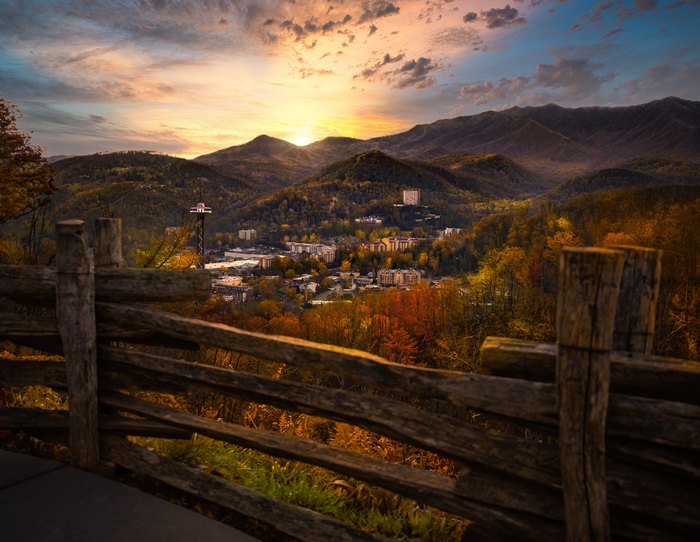
Nature I Wandered Off The Beaten Path On This Iconic Tennessee Location To See One Of The Best Cabins In The Smokies By Chris Dodge
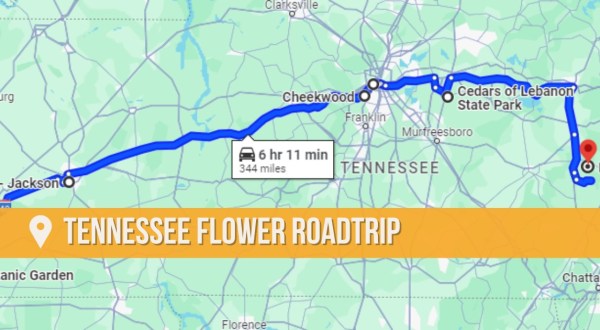
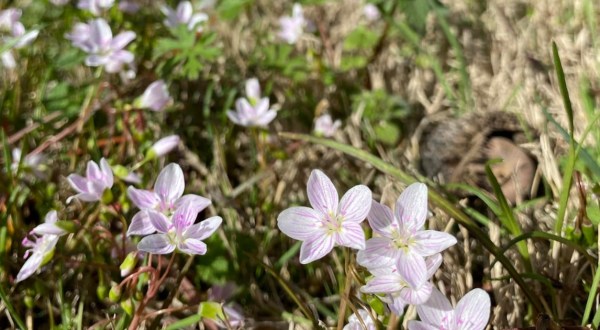
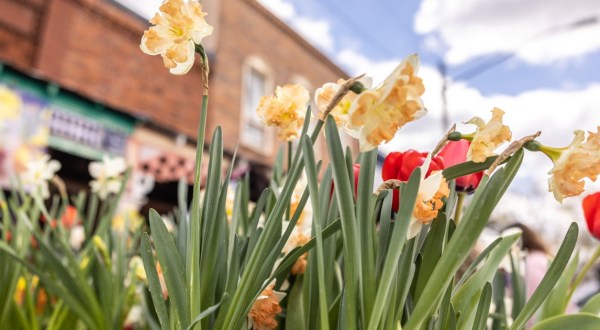
Road trip The Incredible Flower Road Trip Through Tennessee Is The Ultimate Spring Adventure By Chris Dodge
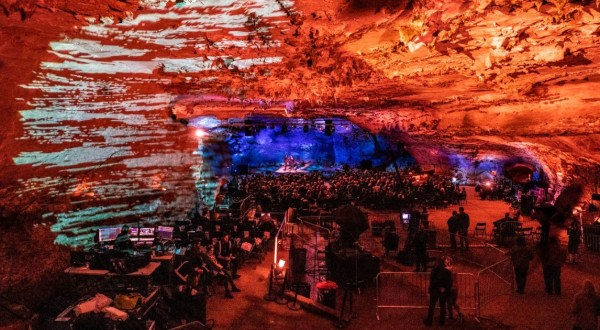
Music This Is The Most Tennessee Sound You’ll Ever Hear, And We Can’t Stop Listening To It By Chris Dodge
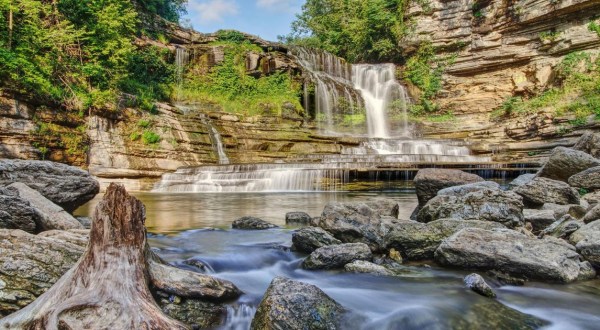
Airbnb 10 Waterfront Retreats In Tennessee That Are Perfect For Warm Weather Adventures By Chris Dodge
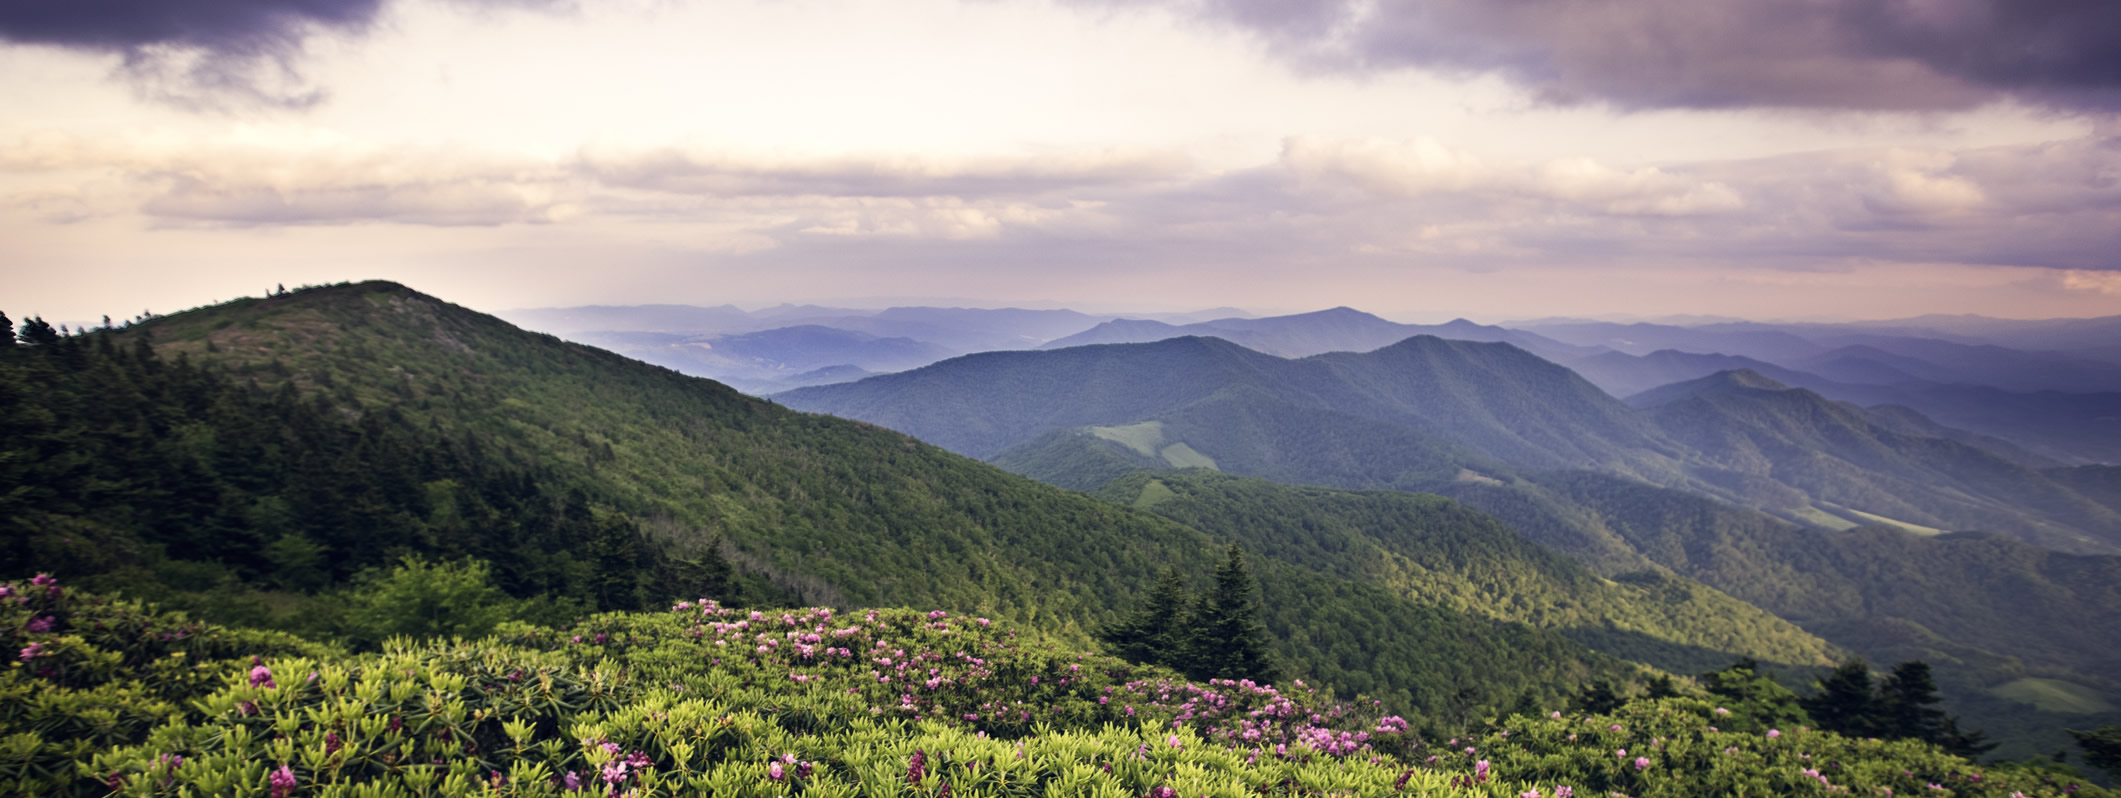
Hike This Easy 4.9-Mile Trail In Tennessee Is Covered In Wildflower Blooms In The Springtime By Chris Dodge
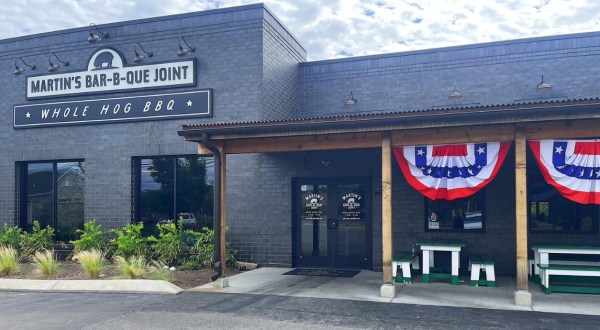
Restaurant The Largest Burger In Tennessee Is Waiting To Challenge You At Kooky Canuck By Chris Dodge
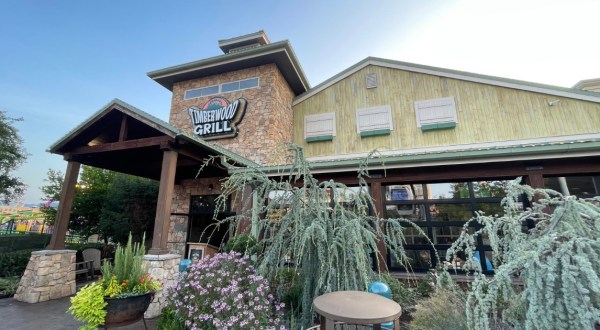
Restaurant We Sank Our Teeth Into A Big Juicy Burgers At The Timberwood Grill In Tennessee By Chris Dodge
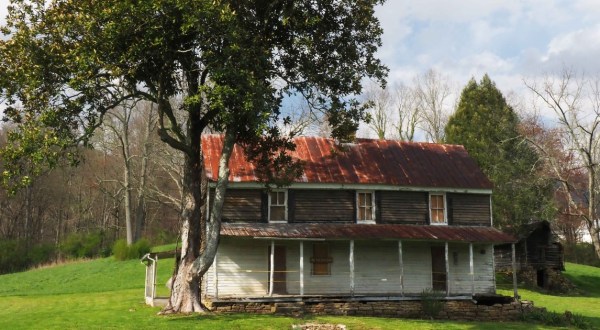
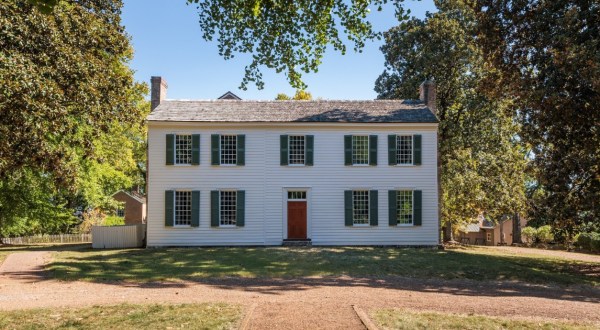
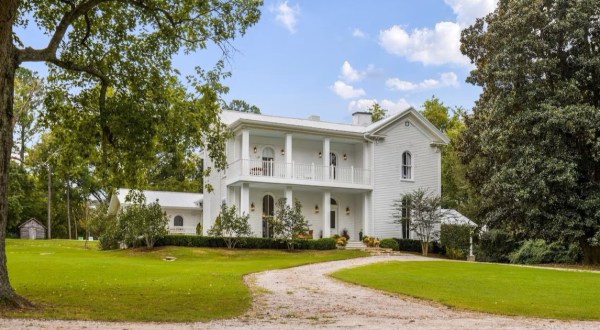
History Travellers Rest In Tennessee Just Turned 225 Years Old And It’s The Perfect Spot For A Day Trip By Chris Dodge
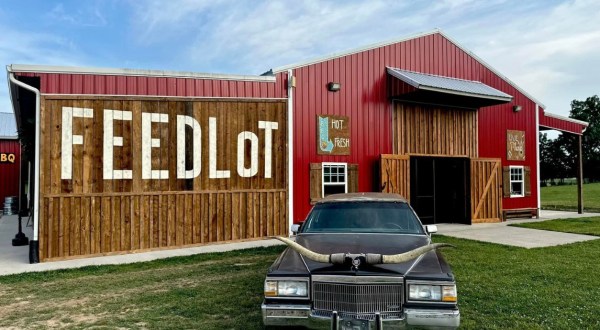
Restaurant Take A Drive To The Country To Dine At This Exceptional Rural Restaurant In Tennessee By Chris Dodge
Waterpark The World’s First Immersive Lazy River Recently Opened In Tennessee, And It Is Absolutely As Cool As It Looks By Chris Dodge
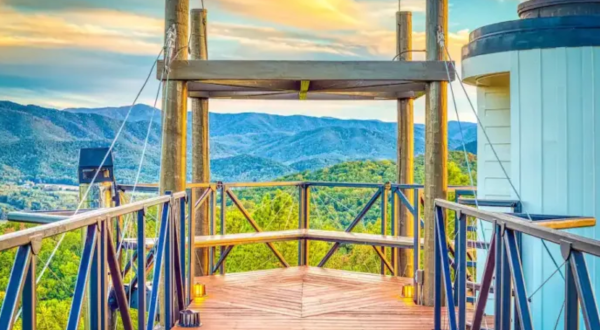
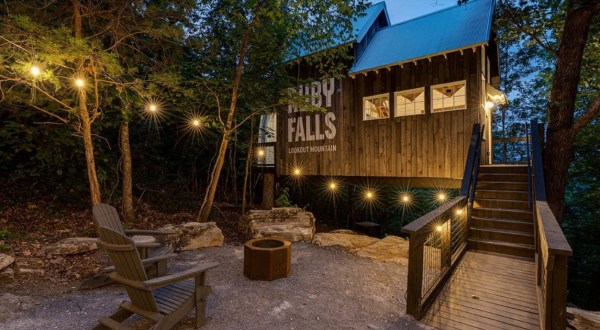
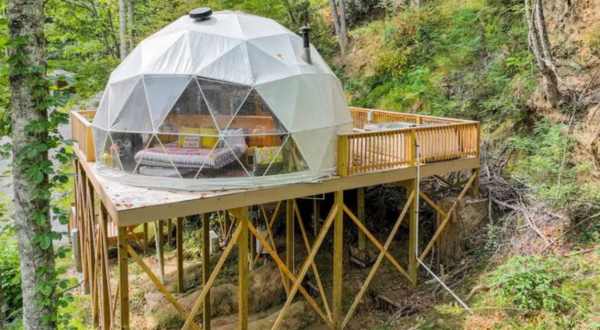
Treehouse Sleep Among The Trees In A Mountain Top Treehouse Above Tennessee’s Tallest Underground Waterfall By Chris Dodge
Spring The Perfect Spring Getaway Starts With One Of These 7 Picture-Perfect Airbnbs In Tennessee By Chris Dodge
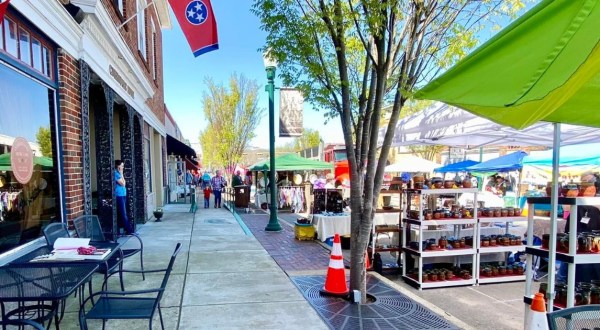
Festival There’s No Better Way To Welcome Spring Than The Blooming Arts Festival In Tennessee By Chris Dodge
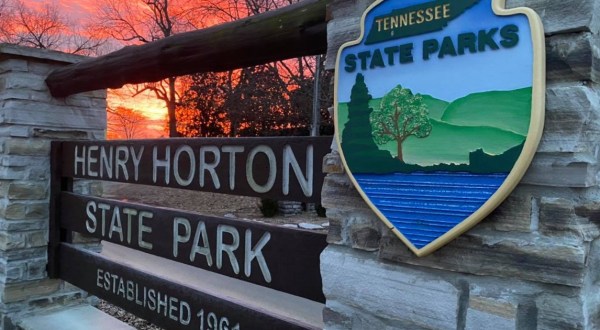
Camping With A Lodge, Cabin Rentals, And A Restaurant, This State Park Campground In Tennessee Is Absolutely Unreal By Chris Dodge
History The Little-Known Story Of Willy The Hillbilly In Tennessee And How He Made A Big Comeback By Chris Dodge
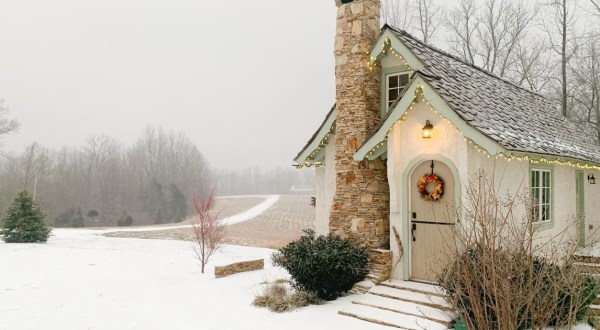
Getaway The Perfect Tennessee Getaway To Take If You Have Been Dreaming Of A Fairytale Getaway By Chris Dodge
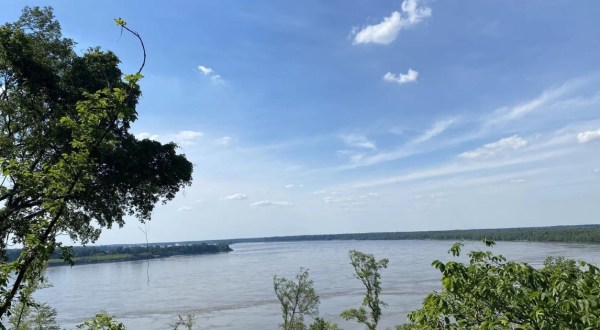
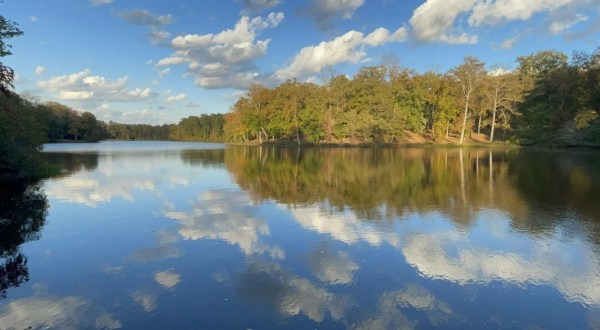
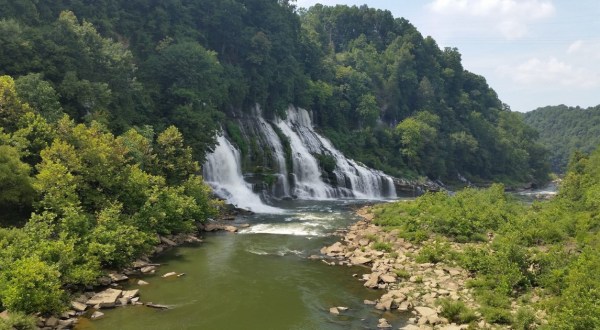
Nature Enjoy A Secluded Stroll On A Little-Known Path Along This Iconic Tennessee River By Chris Dodge
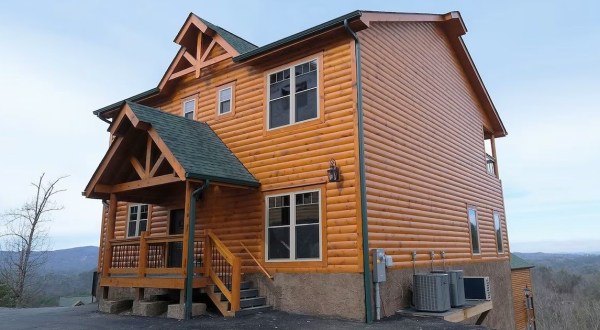
Cabin Plan A Staycation With This Tennessee Cabin That Has A Massive Game Room, Mini Golf, And A Theater By Chris Dodge
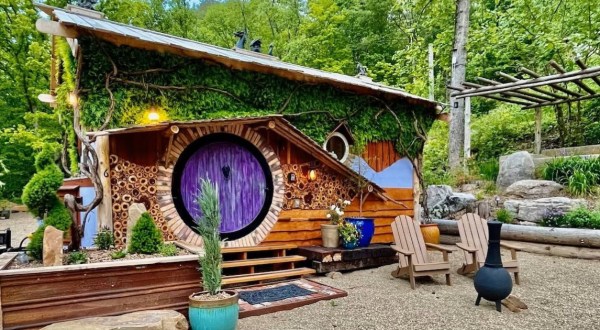
Tiny house Enjoy A Magical Weekend In The Sevierville When You Visit The Mountain Shire By Chris Dodge
Attraction Tennessee’s First Fully Immursive Digital Experience Offers Tons Of Fun For All Ages By Chris Dodge
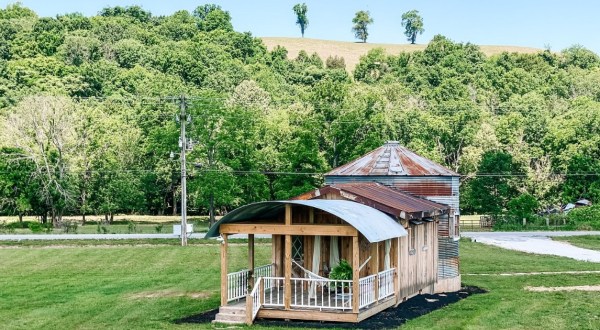
Small town This Is The Most Unique Stay In Tennessee And You’ll Definitely Want To Visit By Chris Dodge
Restaurants Feel The Burn At The Tex-Mex Hot Sauce Bar In Tennessee’s First Tijuana Flats By Chris Dodge
Nature The Iconic Hiking Trail In Tenessee Is One Of The Coolest Outdoor Adventures You’ll Ever Take By Chris Dodge
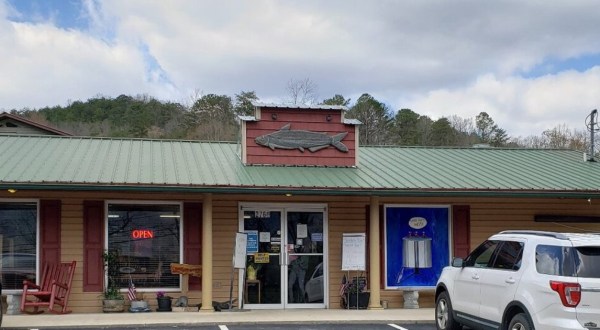
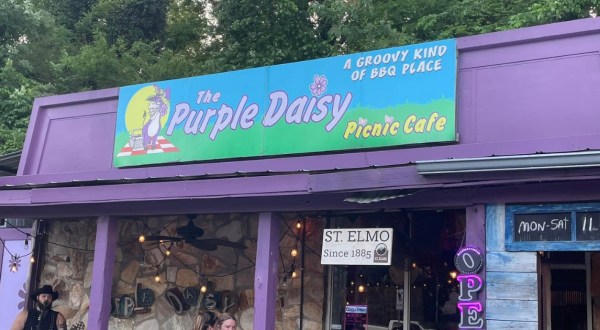
Restaurant Don’t Pass By This Unassuming Picnic Restaurant Housed In An Old Tennessee Gas Station Without Stopping By Chris Dodge
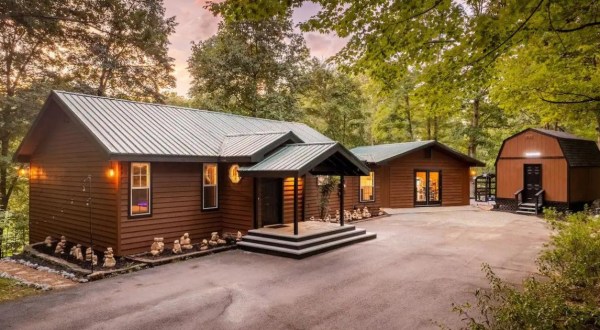
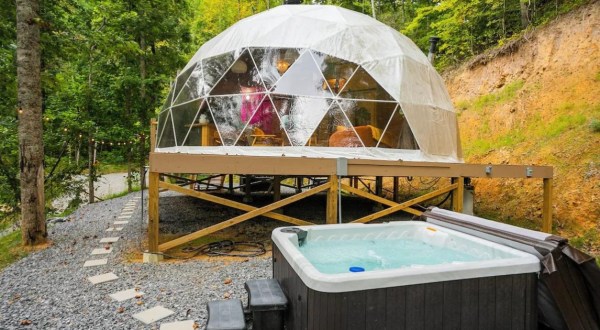
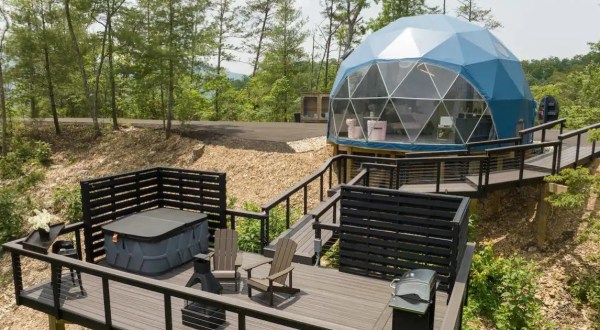
Unique stays Planning A Getaway To Sevierville, Tennessee Is Easy With These 10 Incredible Vacation Rentals By Chris Dodge
Accommodations The Little Known Castle In Tennessee That’ll Be Your New Favorite Destination By Chris Dodge